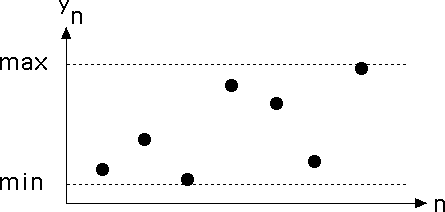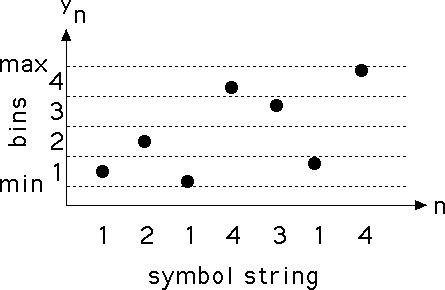
We turn the data into a sequence of 1s, 2s, 3s, and 4s. Suppose we have measured values x1, x2, ..., xN. First, find the range of the values, that is, find the maximum (max) and the minimun (min) of the xi.

|
Next, divide the range (min, max) into four equal-size bins, numbered 1, 2, 3, and 4. Each xi lies in one of these bins, so we can convert the sequence x1, x2, ... into a sequence of 1s, 2s, 3s, and 4s, called the symbol string associated with the data. (We must make some choices if one of the xi lands exactly on the between two bins. For example, we might always take the smaller bin number.)

|
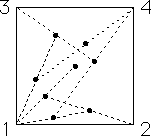
Now we drive the IFS with the symbol string
i1, i2, ..., iN corresponding to the data sequence.
Start with a point p0 at the middle of the unit square. Then
T1(x, y) is the midpoint of the line from (x, y) to (0, 0),
T2(x, y) is the midpoint of the line from (x, y) to (1, 0),
T3(x, y) is the midpoint of the line from (x, y) to (0, 1), and
T4(x, y) is the midpoint of the line from (x, y) to (1, 1).
| Click on the small picture to see how the symbol string above drives the IFS. | 
|
Return to Data-Driven IFS