
GENERAL INSTRUCTIONS: Record all your guesses exactly as you make them; record all your observations exactly as you see them. You will not be graded on the correctness of your guesses, but rather on the clarity of your explanations of why your guesses were right or wrong.
In this lab you will use the program TreenessEmerging, running the random iterated function system algorithm. You will be working in the Deterministic Window, Random Window and in the Parameter Window. The Window Menu allows you to change from one window to another.
Note: the IFS rule is changed by the Rule Menu. You must be in the Parameter Window for the Rule Menu to be active.
(1) Under the Window Menu, select Parameters. Then under the Rules Menu select Eq. Gasket. The screen confronts you with a seemingly formidable table of numbers. There are 14 rows -- only the first three of which have nonzero entries -- and a number of columns -- labelled "R," "S," "Theta," "Phi," "E," "F," and "Probability." The entries under "R" and "S" in the first three rows are all 0.500. These correspond to the scaling transformations ("shrink by 1/2") for the conventional Gasket. Recall
* R = scaling factor in the horizontal direction
* S = scaling factor in the vertical direction
* Theta = rotation of horizontal lines
* Phi = rotation of vertical lines
* E = translation in the horizontal direction
* F = translation in the vertical direction
Under the Windows Menu, select Deterministic. Move the cursor into the upper left of the array of eight boxes. Hold down the mouse button and draw a picture in that box. Now click the Run button. Watch the effect of the three gasket rules. Describe what you see.
(Hint: in later problems you might want to use the Deterministic Window to understand the effect of the individual rules.)
Under the Window Menu, select Random. In the Random Window, click the Run button to see what this Gasket looks like. The image is an equilateral triangle because the translations make it so. We'll get back to this point a little further on.
Now click the Stop button.
(2) Under the Window Menu, select Parameters. Change each of the 0.500's to 0.333's -- i.e., change the "shrink by 1/2's" to "shrink by 1/3's."
To change an entry in the Parameter table,
* move the cursor into the box containing the entry,
* double click the mouse button, darkening the entry,
* type the new entry, and
* press the return key.
What do you think you will get if you run this set of transformations? Make a quick sketch of your guess.
Return to the Random Window and run the program to see what this Gasket looks like. After a few moments, click the Stop button.
How does your sketch compare with what develops on the screen? Explain any differences. If your guess is very close to what you see, explain how you made your guess.
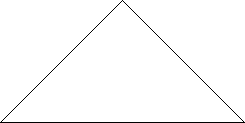
| (3) Return to the Parameter Window. Now, the columns labelled "E" nd "F" correspond to translations in the x- and y-directions, respectively. As resented to you, one translation is (0,0), a second is (0.250,0.433), and the third is (1,0). The second translation is just right to make an equilateral triangular figure. Try to make an isosceles, right triangular pattern which looks like |

|
| How would you have to change the second and third rows of E and F values? Make these changes in the Parameter Window, return to the Random Window, and click the Run button. You may have to use the Scale scroll bar to get the entire picture into the window. To do this, click the Stop button, change the Scale scroll bar, and click the Run button. |
| After you have made your observations, click the Stop button. |
(4) Return to the Parameters Window. Now, try another set of scalings. Pick 0.667 ("shrink by 2/3"), say. You already know what this scaling should produce. Does it? To test this, return to the Random Window and click the Run button.
After making your observation, click the Stop button.
(5) There's no reason why we always have to scale by the same factor in all directions. Let's see what happens if we don't. Return to the Parameters Window and retrieve the original Gasket parameter values by selecting Eq. Gasket from the Rules Menu. Set the three "R" values to 0.333. Before running this set of parameters try guessing what picture they will lead to. Return to the Random Window and click the Run button.Can you explain the actual result?
Now click the Stop button.
What would you get if instead you had changed the "S" values instead of the R's? Try it. With the three "R" values at 0.333, set the three "S" values at 0.667 and run. (You will probably also want to change the change the Scale scroll bar.) (Neat result, don't you agree?)
(6) We can also try different translations in different directions. In the Parameters Window, return to the original Gasket values by selecting Eq. Gasket from the Rules Menu. Now set the second set of "E" and "F" values to 0 and 0.500, respectively. What do you think will happen when you run this picture? Try it.
(7) What happens if we don't shrink the previous picture each time? Start with the original Eq. Gasket parameters. Change the "R" and "S" values all to 1.000. Try to figure out what will happen before clicking the Run button in the Random Window. You will want to change the Scale scroll bar all the way to the left before running. Do you get what you had expected?
Contrast the results you just observed with what happens if you reset the "R" and "S" values to 0.900, for example. Run with the Scale value = 1; then again with the Scale value = 30, say. Can you characterize the differences between "no shrink" and "shrink?"
(8) Start with the original Eq. Gasket parameters and change them to produce a Cantor Middle Thirds Set. (How many rules do you need?)
(9) In the Parameters Window, select Koch Curve under the Rules Menu. (Hint: to understand the individual rules, don't forget the Deterministic Window.) Return to the Random Window and run the program to see that these parameters do indeed give the familiar result. To see that the sign of downward rotation is crucial, return to the Parameters Window and change the two 60.000's to +60.000's. Return to the Random Window and run the program. Can you explain why the resulting picture looks as it does?
(10) Try some other rotation values, such as + and -30¡ instead of + and -60¡, +30¡ instead of +60¡, -30¡ instead of -60¡. In each case predict what you think will happen, then explain why your guess was either correct or incorrect. Try changing "Theta" and "Phi" in rules 2 and 3 of the Eq. Gasket to +30¡ each. (Another neat picture, no?)
(11) We made a big deal about saying that the picture is the rules. What we really mean by that claim is that a given set of rules construct a unique picture. The obverse is not true, however; a picture does not define a unique set of rules. For example, take the first rule in the Eq. Gasket table and change it by making "Theta" and "Phi" both equal 120¡ and "E" equal 0.500. You will get the same Gasket as before when you run with these parameters. Can you see why? (Hint: What do the new transformations do to an equilateral triangle?)
(12) Change "R" in the first line of the Eq. Gasket rules from 0.500 to -0.500. Guess what new picture will occur. Click Run in the Random Window. Can you explain what results?
(13) Change "R" and "S" values in the Koch Curve table from 0.333 to -0.333. What happens when you run these parameters? Explore the impact of other reflections.
(14) Use the Eq. Gasket Rule and run with the parameters as assigned. Note carefully how the Gasket grows. Now, change the three "Probability" values to 0.600, 0.200, and 0.200, respectively. Guess how this will affect the growth of the Gasket. Run with these new parameters. Carefully observe the new growth. Explain what you observe.
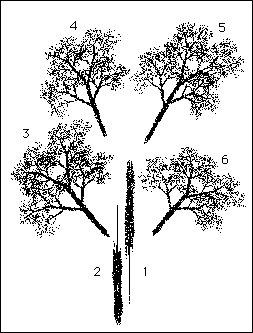
| (15) The figure below depicts the six transformations which make up the IFS code for the "tree." That is, piece 1 is what you would get if you applied transformation 1 to the whole Tree. The pieces are pulled slightly apart to emphasize the action of the respective transformations. |

|
| Examine the Parameter Window for the Tree Rule to see how each piece of the figure is generated. Return to the Random Window. In the top box of the Address column, change the 0 to 1 by in the same way you change entries in the Parameters Window. |
| Now click the mouse arrow in the Address box, causing an X to appear. |
| Click Run. Every time rule 1 is applied, a small circle is drawn. |
| Now click ClearAddr. Change the top address box from 1 to 2 and click Continue. After a moment, click Stop. Describe what you see. |
| Repeat this, changing the top address in turn to 3, 4, 5, and 6. |
| Now click ClearAddr. Leave the top address as 6, and change the second address to 5. After a moment, click Stop. Circles will be drawn on those points for the last rule was 6 and the preceding rule was 5. Does what you see in the box make sense? Try a few more address combinations and describe what the right box shows in each case. |
Return to Labs