by A. Student
How can we tell if something is behaving chaotically? We believe this is a hard problem [1]. Many tests are based on computing numbers, sometimes a dimension, sometimes a related number, from the measurements [2]. But measurements always have errors - how could it be otherwise? Think of how we measure the temperature of a bath. We put a thermometer into the bathwater and look at how high the red column rises in the thermometer. Can we tell if the column is at 102.23 degrees? Probably, we can't see that closely, and moreover, it's possible a different thermometer would give a slightly different reading. After all, the thermometers aren't made identically. So if we compute a number from measurements, we have to be careful in how we interpret the number. How sure can we be of the number is right? How do the uncertainties of the measurements affect the certainty of our knowledge of the number?
How to deal with the effects of uncertainties is one of the topics of statistics [3]. Another approach is to use more visual interpretations of the measurements. Chapter 6 of [4] presents several of these methods. I was interested in the IFS method, in no small part because it gives some answer to a term-long question: just how are fractals and chaos related? With the IFS method, we see chaotic numbers often produce fractal representations. Initially, I intended to use this method to study some real data, but I got side-tracked by a question about the method itself. This question became the focus of my project, and that is what I report here.
To begin, we review the IFS method. Suppose we have a series of measurements of something - noontime temperature outside the college center, daily closing price of GE stock, or anything. To use the IFS method, we have to translate this series of measurements into a series of 1s, 2s, 3s, and 4s. One way to do this is to find the largest value, MAX, of the measurements, find the smallest value, MIN, of the measurements, and divide the distance between them into four equal pieces, or bins. For example, if MIN = 0 and MAX = 1, we assign 1 to all measurements between 0 and 0.25; 2 to all measurements between 0.25 and 0.5; 3 to all measurements between 0.5 and 0.75; and 4 to all measurements between 0.75 and 1. Then we play the four-corner chaos game, applying rule 1 every time we encounter 1, rule 2 every time we encounter 2, and so on. This seems clear enough, but I wondered why the distance is divided into four equal bins, and how the picture would change if the bins changed. This became my project. To be able to understand the numbers measured, I decided to work with measurements generated by the logistic map.
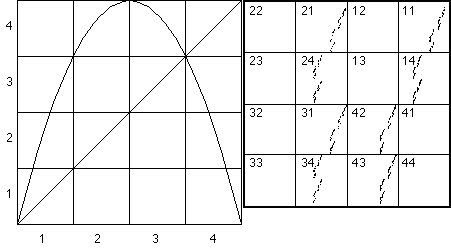
I began with the case of equal bins. The right side of Figure 1 is Figure 6.27 of [4]. The left side of Figure 1 shows a graph of the s = 4 logistic map, with bins divided at 0.25, 0.5, and 0.75. This graph is the key to understanding the four-corner chaos game picture. Note if a measurement lies in bin 1, the next measurement can lie in bin 1, 2, or 3, but not in bin 4. (The graph takes points in bin 1 into bin 1, 2, or 3, but not into bin 4.) Continuing, we see if a measurement lies in bin 2, the next measurement must lie in bin 4; if a measurement lies in bin 3, the next must lie in bin 4; and if a measurement lies in bin 4, the next must lie in 1, 2, or 3, but not in 4. Since 1 cannot be followed by 4, in the four-corner chaos game picture, the 1 part of square 4 (the square with address 41) must be empty. The other restrictions on what cannot follow what imply the squares with addresses 12, 22, 32, 13, 23, 33, and 44 must be empty, and we see they are.

|
| Figure 1 Left: the s = 4 logistic map with bins divided at 0.25, 0.5, and 0.75. Right: the corresponding four-corner chaos game plot. Addresses are included for reference. |
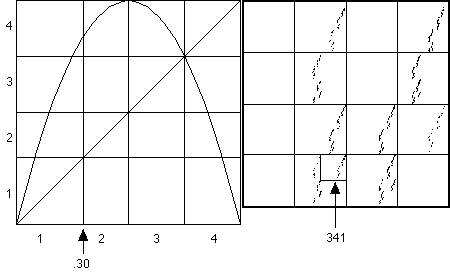
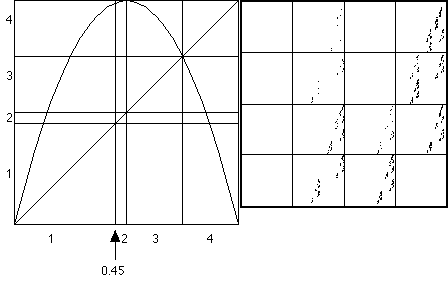
With the DesparatelySeekingChaos program, we can change the bins and replot the picture. I did this, in turn replacing the 0.25 with 0.3, 0.35, 0.40, 0.45, and 0.5. Figures 2, 3, and 4 show the results for 0.3, 0.45, and 0.5. Let us try to understand some of these changes.
In the logistic map graph on the left side of Figure 2, the only change is that now a measurement in bin 1 can be followed by a measurement in bin 4. As a consequence, square 41 should no longer be empty, and indeed in the left side of Figure 2 we see some points in square 41. I was pleased to see my prediction was right, and was about to move on to the next change, when I noticed something else. Carefully comparing the right sides of Figures 1 and 2, we see that squares 34 and 43 of Figure 2 have points in some regions where squares 34 and 43 of Figure 1 are empty. So right away, I found the problem is trickier than I'd thought. We'll return to this point at the end of the paper.

|
Figure 2 Left: the s = 4 logistic map with bins divided at 0.3, 0.5, and 0.75. Right: the corresponding four-corner chaos game plot. The square 341 is indicated for later use. |
In Figure 3 I show the results of moving the boundary between bins 1 and 2 to 0.45. Comparing the right sides of Figures 2 and 3, the first thing I noticed is that there are very few points in square 2 of Figure 3. This puzzled me a little until I looked at the right side of Figure 3. See how small bin 2 is? Very few points are going to get into bin 2. This much is easy to understand - but there is another difference less clear: there is a region of square 14 in Figure 3 that is empty in Figure 2. I believe this, and similar differences between Figures 2 and 3, are related to our comment about squares 34 and 43 in Figures 1 and 2. So again, changing the bin boundary has an unexpected (by me, anyway) consequence.

|
Figure 3 Left: the s = 4 logistic map with bins divided at 0.45, 0.5, and 0.75. Right: the corresponding four-corner chaos game plot. |
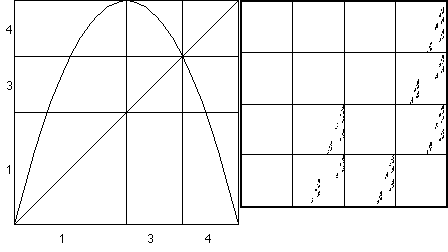
Finally, in Figure 4 I show the result of moving the boundary between bins 1 and 2 to 0.5, making it very unlikely that a measurement ever lands in bin 2. In fact, for this to happen, the measurement must be exactly 0.5, an event that would happen rarely. As a consequence, the big square 2, the upper left quarter of the right side of Figure 4, is empty. Because this square is empty, every square with address containing 2, for example, the 2 part of square 1, is empty. If these were the only empty squares, what would the four-corner chaos game picture look like? What's the most common answer in class? It's "the gasket," and sure enough, that's the answer here, except instead of the usual left-handed gasket we draw in class, this is a right-handed gasket. But still, it's a gasket, and the four-corner chaos game plot in Figure 4 doesn't look like the gasket.
So what's the problem? Look at the left side of Figure 4. A measurement in bin 1 can be followed by a measurement in bins 1, 3, or 4, so squares 11, 31, and 41 have points in them. But a measurement in bin 3 must be followed by a measurement in bin 4, and so the squares 13 and 33 are empty (note square 43 is occupied). Finally, a measurement in bin 4 must be followed by a measurement in bins 1 or 3, so square 44 is empty (note squares 14 and 34 are occupied). All these empty squares are occupied in the gasket.

|
Figure 4 Left: the s = 4 logistic map with bins divided at 0.5, 0.5, and 0.75. Right: the corresponding four-corner chaos game plot. |
Before drawing my conclusion, I come back to this surprising point about unexpected changes in the four-corner chaos game pictures. I focus on one of the differences between the four-corner chaos game pictures of Figures 1 and 2: that square 341 is empty in Figure 1 and not empty in Figure 2. With a hint from the teacher, I asked how points could wind up in square 341. It must be possible to have a measurement in bin 1 followed by a measurement in bin 4, in turn followed by a measurement in bin 3. With that one simple hint, everything became clear. With the bins of Figures 1 and 2, a measurement in bin 4 can be followed by a measurement in bin 3. But while with the bins of Figure 2, a measurement in bin 1 can be followed by a measurement in bin 4, this cannot happen with the bins of Figure 1. So I conclude the smaller regions of the four-corner chaos game give information about whether or not longer sequences of measurements can occur.
This brings up my conclusion. The four-corner chaos game pictures presented here all come from the same sequence of measurements, yet the pictures look quite a bit different. When we want to compare the pictures for different sequences of measurements, we should be sure the comparisons make sense. Why would we use certain bins for one sequence of measurements, and other bins for other measurements? If we did, how could we compare the pictures? To use the same bins for all measurements, the simplest choice seems to be dividing the distance between MAX and MIN into four equal pieces.
But I'll end on a cautionary note. Maybe for some kinds of measurements, a different choice is better. After all, changing the bins in these figures certainly brought out different features of the pictures. Before plotting the picture, you should try to know as much as you can about what you're studying. This sounds like good advice for life in general.
References
[1] Stewart, Does God Play Dice?
[2] Packard, Crutchfield, Farmer, Shaw, Geometry from time series, Physical Review Letters 1980, 712-715.
[3] Mendenhal, Introduction to Probability and Statistics
[4] Peak and Frame, Chaos Under Control
Go to Project 1
Return to Projects
Return to Chaos Under Control