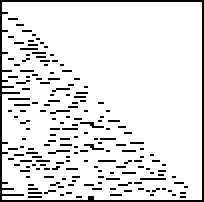
In this lab you will use the program DesparatelySeekingChaos. You will be working in the IFS Window, Close Pairs Window and in the Kelly Window.
* The Option Menu allows you to change from one window to another.
* The Data Menu lets you select the type of data to analyze: Logistic map, Tent map, Uniform Random, Normal Random, 1/f, Brownian, and Homemade.
1. In the IFS Window, set Iter = 500 and Drop = 0. From the Data Menu select Logistic.
(a) Set Param = 1.5. Click the Run button. Click the Plot button. What do you see? Repeat with Drop = 100. Describe what you see and explain the difference.
(b) Reset Drop to 0. Set Param = 2.5. Click the Run button. Click the Plot button. What do you see?
(c) Repeat (b) for Param = 3.2, 3.55, 3.7, 3.83, and 3.9.
2. Now select Tent from the Data Menu.
(a) Set Param = 1.2. Click the Run button. Click the Plot button. What do you see?
(b) Repeat (a) for Param = 1.4, 1.6, and 1.8.
3. In the ClosePairs Window, set Iter = 100, Drop = 0, Dot Size = 2x2, and No Singletons. From the Data Menu select Logistic.
(a) Set Param = 3.2. Click the Run button. Click the Plot button. What do you see?
(b) Repeat (a) for Param = 3.52, 3.65, 3.75, 3.83, 3.86, and 3.9.
(c) Experiment with the Filter Size (keeping the number between 0 and 1). Describe how changing the filter size can change the Close Pairs Plot.
4. Now select Tent from the Data Menu.
(a) Set Param = 1.2. Click the Run button. Click the Plot button. What do you see?
(b) Repeat (a) for Param = 1.4, 1.6, and 1.8.
5. In the Kelly Window, set Iter = 400 and Drop = 0. From the Data Menu select Logistic.
(a) Set Param = 3.2. Click the Run button. Click the Plot button. What do you see?
(b) Repeat (a) for Param = 3.5, 3.55, 3.65, 3.83, and 3.9.
6. Now select Tent from the Data Menu.
(a) Set Param = 1.2. Click the Run button. Click the Plot button. What do you see?
(b) Repeat (a) for Param = 1.4, 1.6, and 1.8.
7. (a) Compare the observations you made with these three methods for the Logistic map with Param = 3.2. Each method is analyzing the same sort of data. What do the different methods tell you?
(b) Repeat (a) for param = 3.83 and for Param = 3.9.
(c) Compare the observations you made with these three methods for the Tent map with Param = 1.2.
(d) Repeat (c) for Param = 1.6.
8. Do some explorations on your own. Describe what you are investigating, and how closely your observations agree with your expectations.
Return to Labs